GEO-Maps
Help Index > GEO-Maps
1. Background
Emerging health geography research analyses and visualizes health behaviours and outcomes in relation to urban environmental data and related
official statistics to produce “health reports” for specific areas. This can be extended to developments in urban planning, e.g., to identify districts or
neighbourhoods for social investments or restrictions.
2. Problem
While, data generated by epidemiological studies typically are analysed without any spatial relationship, we focus on joining data from different domains,
such as public statistics and study data. This requires a concept allowing to integrate external data, such as public statistics, but also to join data.
The latter needs to consider different temporal and spatial granularities and relationships.
3. Solution
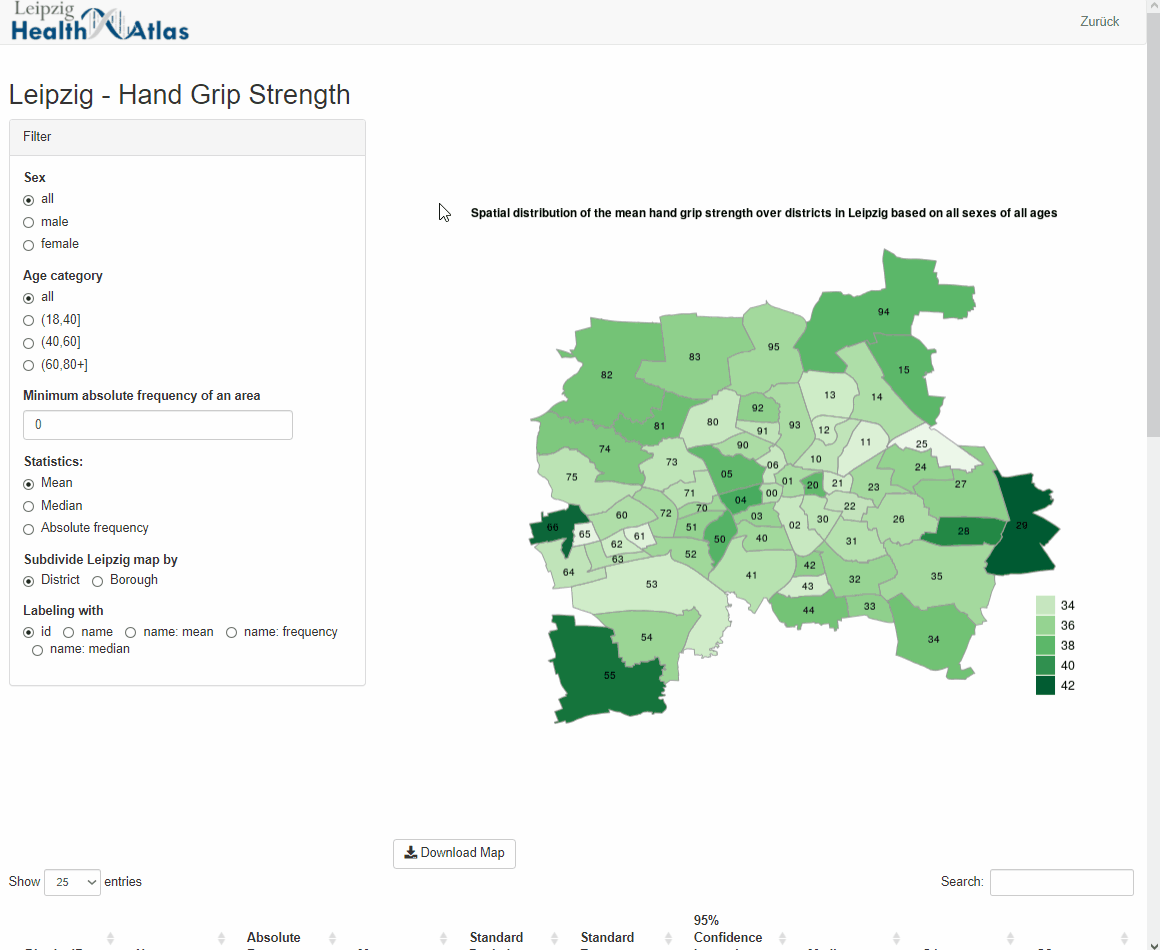
We designed web applications allowing to visualize study data on Leipzig maps to study the distribution over all city districts in Leipzig and to recognize
outlier regions. We reuse the captured medical data of the epidemiological study LIFE Adult (10,000 participants). An exemplified application shows the
number of participants over different WHO classes for body-mass-index, such as underweight, normal weight, overweight, and heavy weight.
4. Guided Tour
- Head over to ‘Models’ using the menu bar
- Find the ‘Hand Grip Strength in Leipzig’ tool using the search, or the link below
(https://www.health-atlas.de/lha/7RVK32XTF3-8) - on the right side click on the Shiny button, or use the link below
(https://apps.health-atlas.de/le-map-hgs/)